Netflix Global Affordability Index
You’ve heard of The Big Mac Index. 🍔
Here’s the Netflix Index.
Like a Big Mac, Netflix is one of the most ubiquitous consumer products on the planet, available in over 190 countries, spanning income levels, connectivity, and cultures. That makes it a powerful lens for exploring pricing, access, and global inequality.
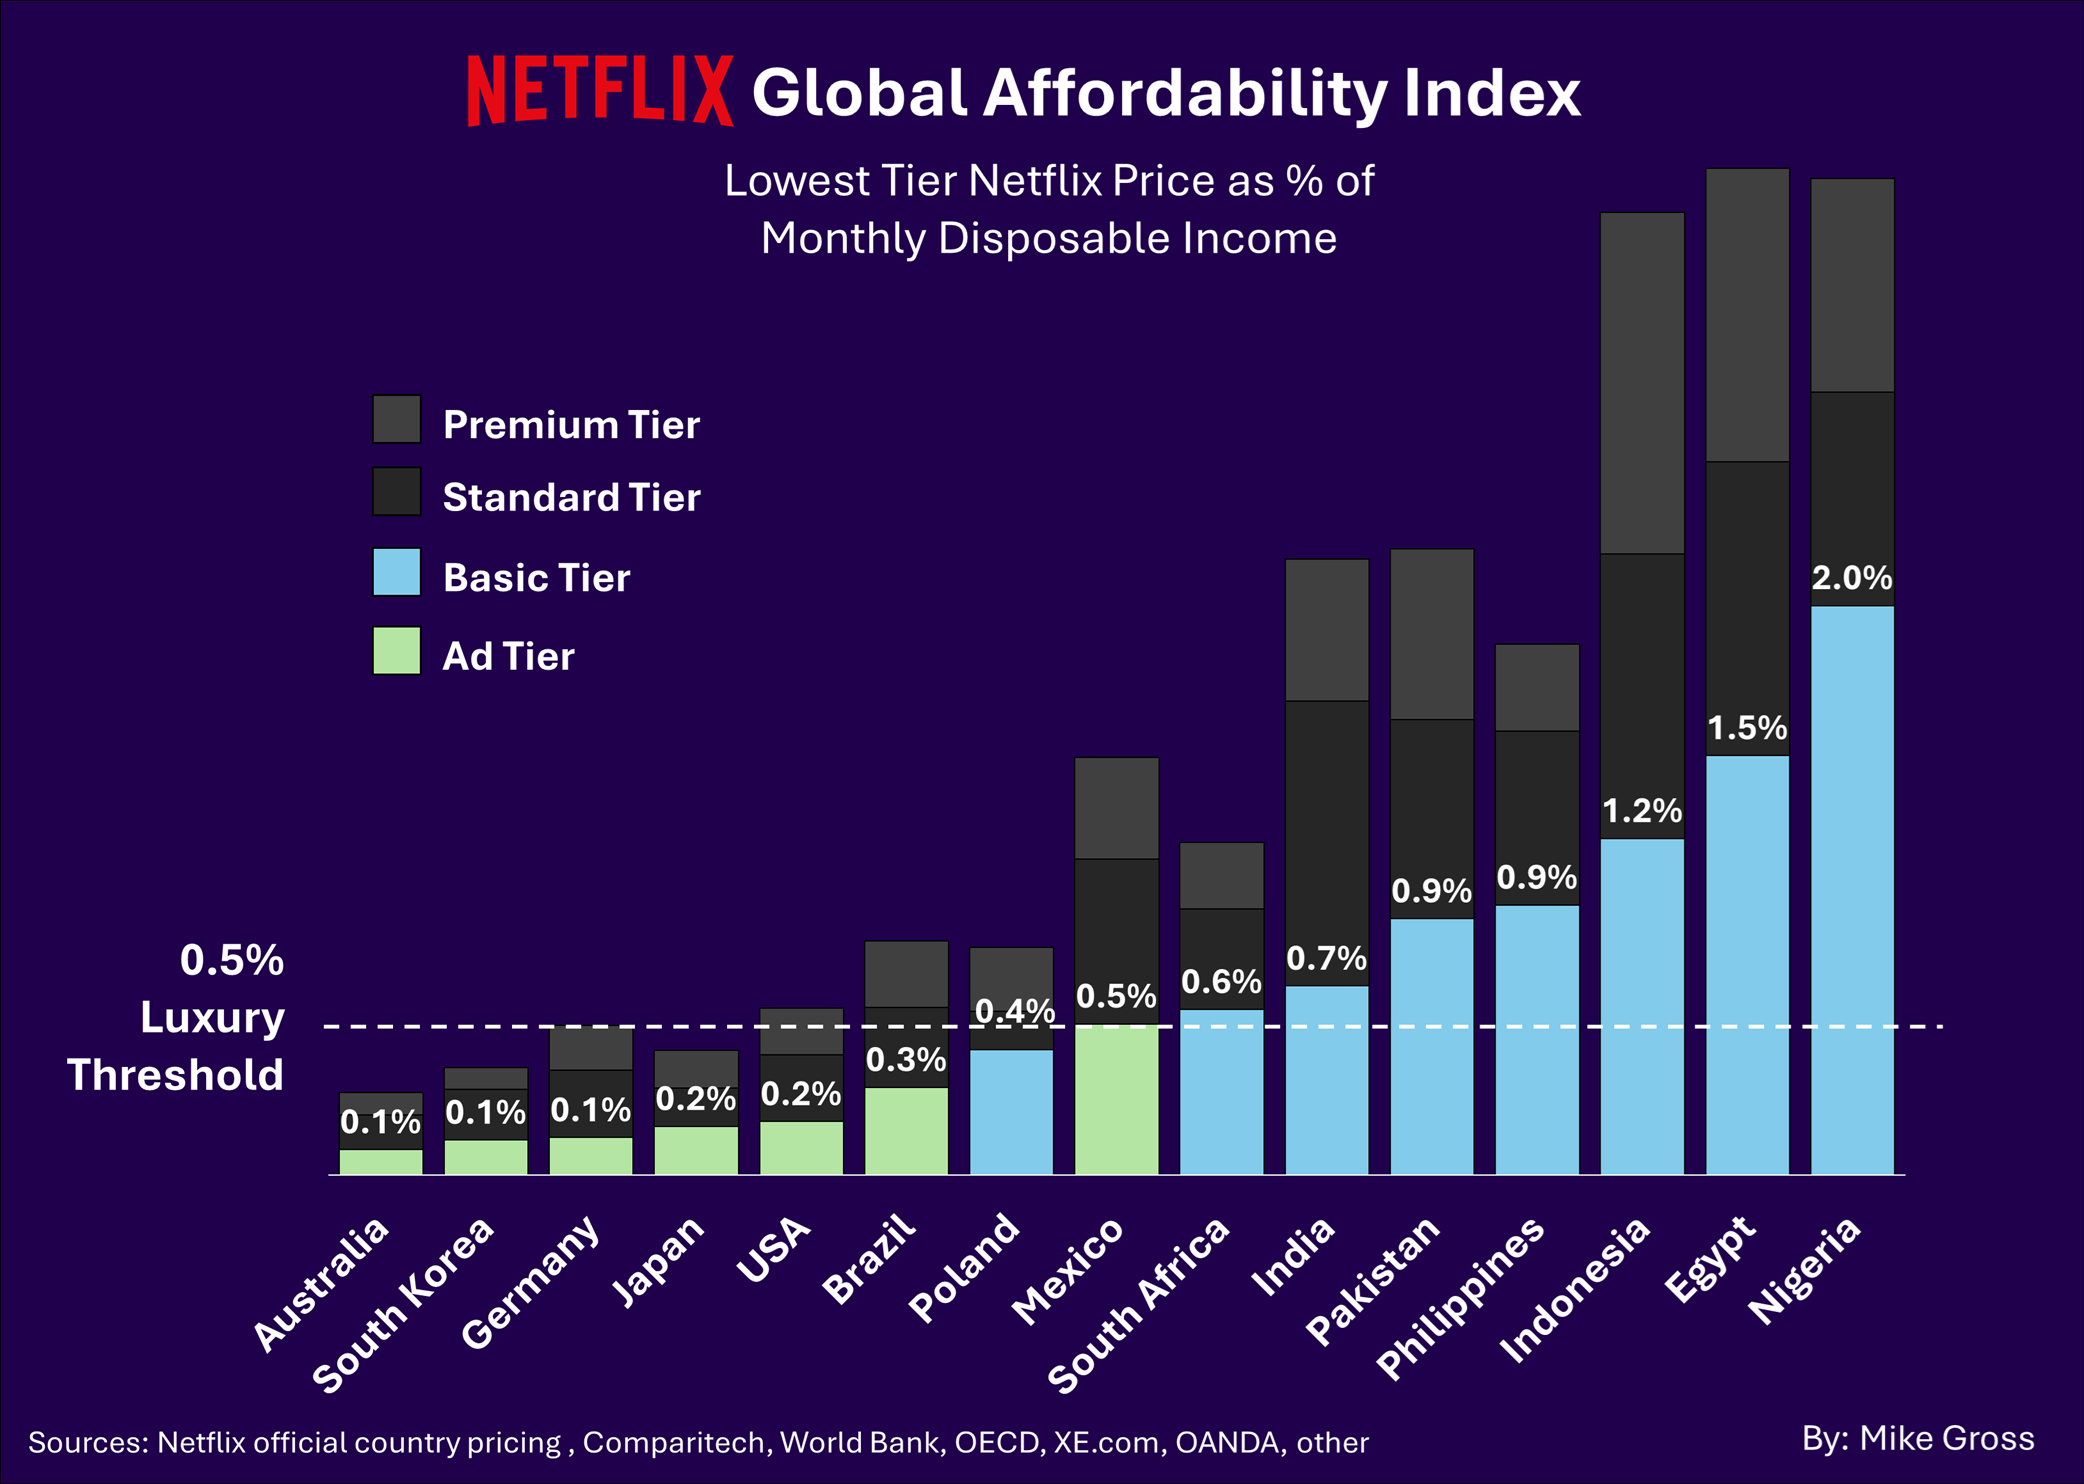
This chart shows the cheapest Netflix plan in 15 countries as a percentage of monthly household disposable income.
Behind each bar are the Standard and Premium tiers for reference.
A “Luxury Threshold” at 0.5% marks the point where a subscription stops being background spending and starts becoming a real decision.
In Australia, Germany, and South Korea, the cheapest plan costs just 0.1-0.2% of income, about the same as a cup of coffee.
But in countries like Indonesia, Egypt, and Nigeria, even the lowest-tier Netflix plan costs 1-2% or more of income.
That’s not just a subscription.
It’s a week of mobile data.
A full day of electricity.
Multiple meals for a whole family.
And while ad-supported tiers help, they’re mostly available in countries that can already afford Netflix.
It’s the unfortunate reality that stronger ad markets exist where fewer people actually need the subsidy.
In the end, affordability isn’t about price, it’s about what people have to give up to say yes.