Turning Spend into Revenue
Last time I shared a chart on Content Spend vs. Audience, Amazon sat well below the line.
Many of you said: “It’s not just about audience, it’s about revenue.”
Turns out you were right.
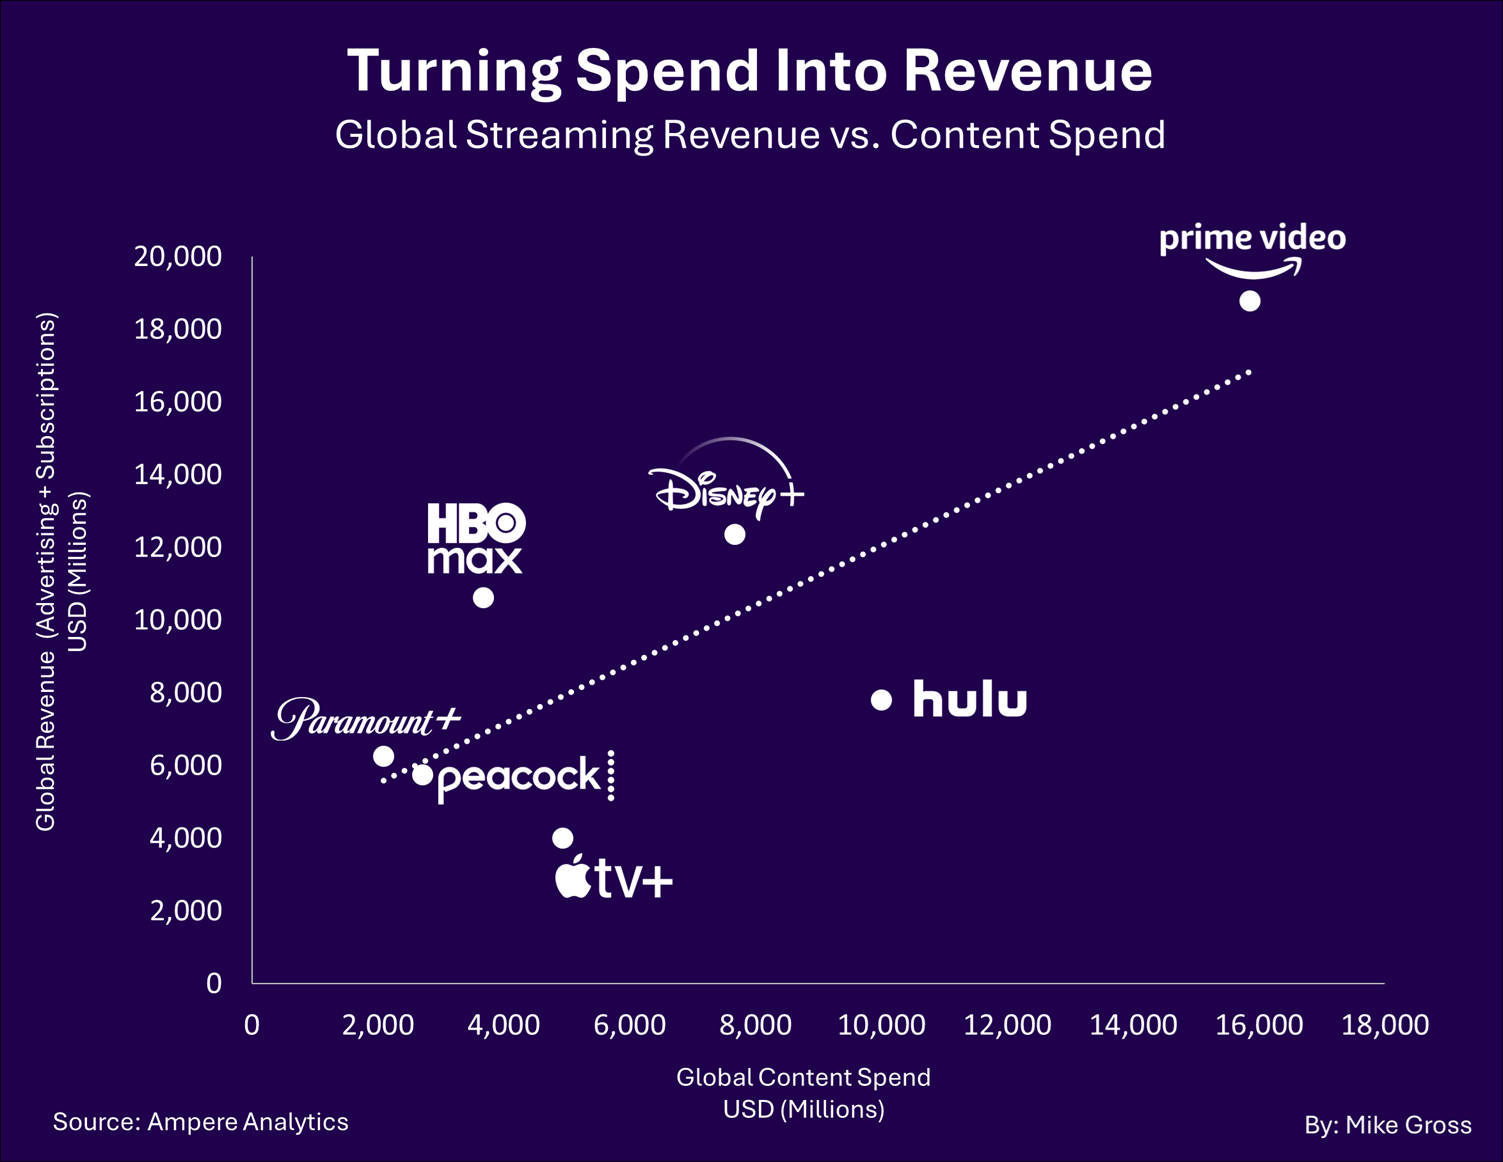
Using Ampere Analysis data, this chart maps Global Streaming Revenue (Subscriptions + Ads) vs. Content Spend. Amazon now sits above the line, thanks to Ampere’s approach of allocating part of Prime’s subscription value to Prime Video.
(Note that Netflix is excluded. They’re so high up they’d blow out the scale.)
So here’s the question: How does Amazon have such low viewership, yet manage to monetize so well?